

Our Mimetic Culture
People Who Influence (and Are Influenced By) the Desires of Others

Let’s have some fun.
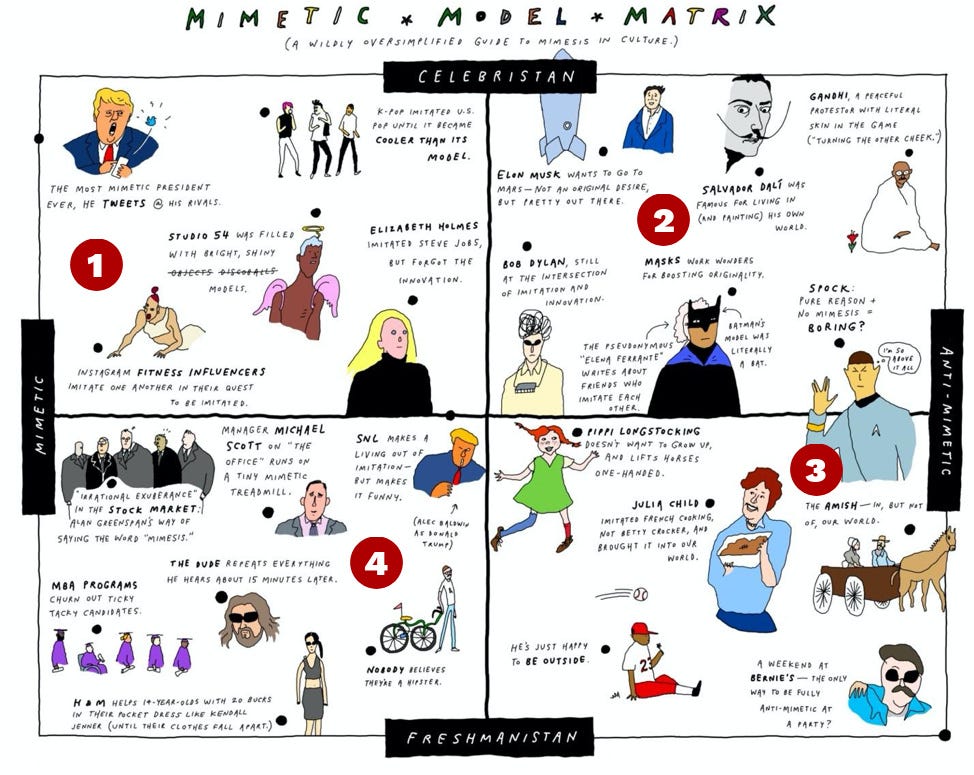
I’ve plotted a few cultural figures on this four-quadrant grid. We can situate people and groups according to two criteria:
1) Mimetic Axis (Left —> Right): We can plot from left to right according to how mimetic the person or group seems (the left is hyper-mimetic; the right is less mimetic)
2) Proximity Axis (Top —> Bottom). We can plot from top to bottom according to how far the person or group is socially separated from others. In Celebristan (top), there’s generally a large distance separating models from imitators. In Freshmanistan (bottom), there’s less separation.
It’s important to note that the placement of everyone on this matrix only makes sense in relation to some “hidden” person who is not on the matrix at all—a person who stands in relation to everything. On my matrix, that person is some kind of everyman.
If the point of reference of this matrix changed from everyman to Elon Musk, then the whole thing would look differently. We’d be looking at the…
